Google Analytics Dashboard Part 2 – Goals and Events
In part 1 of this series, we discussed the initial steps in creating your dashboard, and how to delete what isn’t important. In this post, we’ll go through the steps in creating events and goals, then we’ll add some some important items to the dashboard.
Our destination in this post is going to be to add some measurement around visitors that download some important documentation – for instance, a product specification form. Perhaps we have an on-line business model where customers download a specification form in the hope that this then leads to an on-line purchase. But now the boss is complaining that he doesn’t think the form is very attractive, and believes that a redesign would prompt more people to follow up on an order.
But the problem is that we don’t even know off hand how many times our specification sheet is downloaded, much less whether or not the redesign leads to more actions. So, as a first step, let’s get Google Analytics to record whenever a visitor downloads the specification sheet.
If you were to look at the HTML code underlying the page with your specification sheet, it would look something like this:
<a href=”http://www.yourwebsite.com/Documents/Product XYZ.pdf”><img alt=”Download product XYZ specification sheet.” src=”http://www.yourwebsite.com/images/DownloadIcon.jpg”></a>
We are going to add a Google Analytics Event to this code. An Event is essentially a little piece of code that, whenever it is activated, tells Google Analytics to take notice and record it. What we can do is add it to the HTML code above so that whenever a visitor clicks on the download button, Google Analytics records that action.
If you look in the Google Analytics documentation, you’ll find a specification for the _trackEvent method that says the following:
_trackEvent(category, action, opt_label, opt_value, opt_noninteraction)
Below, we’ll show an example of how to put this into your code, but first we have to figure out what all these parameters mean, and how best to set them. The official description of each of these parameters are:
- category (required): The name you supply for the group of objects you want to track.
- action (required): A string that is uniquely paired with each category, and commonly used to define the type of user interaction for the web object.
- label (optional): An optional string to provide additional dimensions to the event data.
- value (optional): An integer that you can use to provide numerical data about the user event.
- non-interaction (optional): A boolean that when set to true, indicates that the event hit will not be used in bounce-rate calculation.
In essence, Google Analytics provides four items that you can customize to suit how you need to track the action. You have total freedom to set the three string and one integer parameters as you need. So, for our example, we may want to have the following
- category: ‘Product XYZ’
- Action: ‘Download Spec Sheet’
- Label: ‘Product Page’
- Value: 1
- Non-Interaction: True
So, to implement this event in your website, you have to update your HTML to read:
<a onclick=”_gaq.push([‘_trackEvent’, ‘Product XYZ’, ‘Download Spec Sheet’, ‘Product Page’, 1, true]);” href=”http://www.yourwebsite.com/Documents/Product XYZ.pdf”><img alt=”Download product XYZ specification sheet.” src=”http://www.yourwebsite.com/images/DownloadIcon.jpg”></a>
Now, every time a visitor downloads your document, Google Analytics knows about it. From your perspective, since you have identified this as an important action, you now have a means to keep track of how often it is being downloaded.
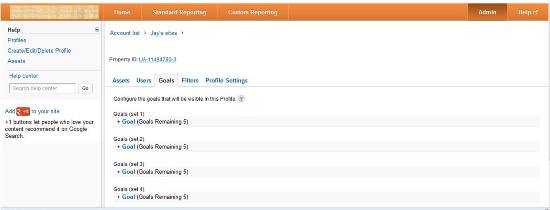
Now, let’s set this up as a goal in your Google Analytics. Once you’ve logged into Google Analytics, click on the “Admin” near the top of the page on the right. If you have multiple profiles, at this point, you may have to select the profile you’re working on. Once you do this, you should see a “Goals” tab. Click on this, and you should see a screen like the one below.
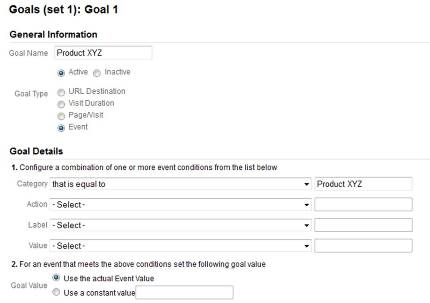
Google Analytics lets you specify up to 20 goals, in four sets of five each. We are going to set up a goal in the first set, so click on the “+ Goal” in the first goal set. In the next screen, give the goal a name (say “Product XYZ”), and specify that this is an Event. For the goal details, choose the category option “that is equal to”, and fill in “Product XYZ” in the box. Leave all the other options either empty or equal to the defaults. Once you have done this, choose “Save”.
Congratulations, you’ve just set up your first goal in Google Analytics. Now, remember when we first set up the dashboard, we left in the widgets dealing with Goals? Now, whenever we get someone downloading your product specifications, Google Analytics will record that action, and your dashboard will update.
Creating events in Google Analytics is very powerful and flexible, particularly when we combine them with goals and add them to the dashboard. In the example above, when we defined our goal, the only event parameter that we specified was “Product XYZ”. So now, if we have set up other events dealing with “Product XYZ”, such as a visitor downloading an order form, or perhaps a visitor clicking on a button that automatically generates an inquiry about Product XYZ, so long as you have set the Event Category equal to “Product XYZ”, all activity around this product will generate events, and can be analyzed together through this one goal.